[Last Updated: 3/19/2024]
This post will document the development and usage of a new proposed candlestick parameter called Center of Mass. The Center of Mass value is based on OHLC price values of single candlesticks.
You can use the Center of Mass value as an indicator – either with raw calculated values, or you can average it with something like a Simple Moving Average (SMA) or Exponential Moving Average (EMA).
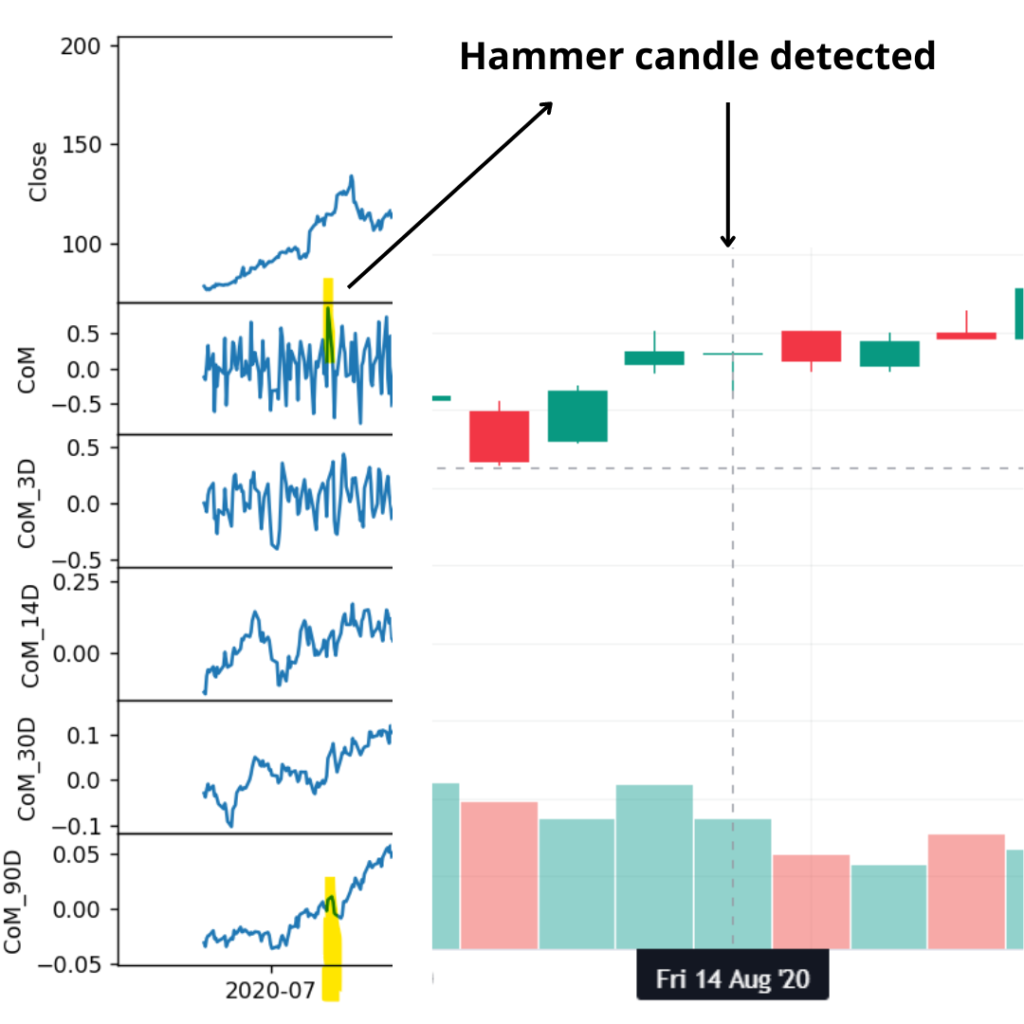
At the end of this post, the Center of Mass value is used to detect the presence of Hammer candlesticks.
Candlestick Pricing Definitions
Candlesticks represent the trading activity that occurs in a specific timeframe. In this post, that timeframe is daily. The candlestick is defined by four prices:
- Open: The price that the security opened at the beginning of the timeframe.
- Close: The price that the security closed at the end of the timeframe.
- High: The highest price that the security reached during the course of the timeframe.
- Low: The lowest price that the security reached during the course of the timeframe.
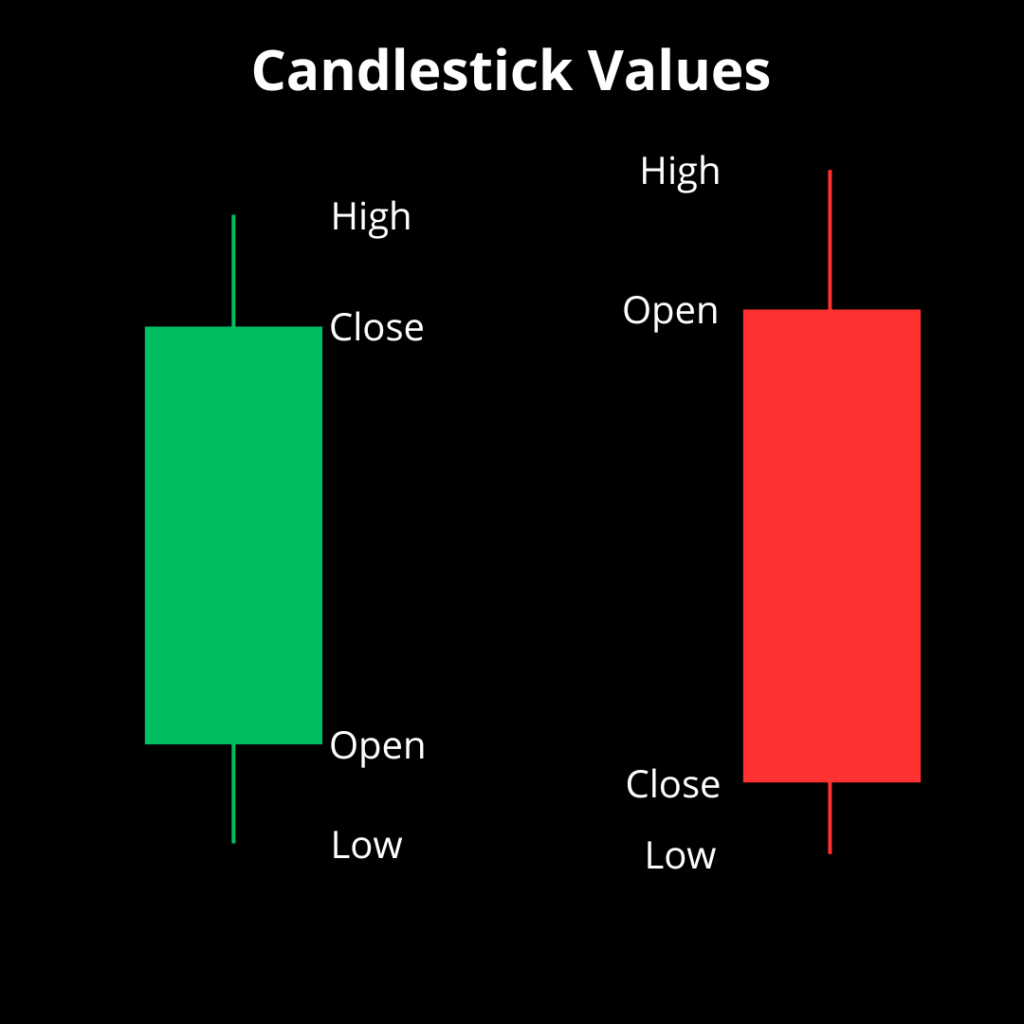
These four prices are often abbreviated as “OHLC” values – short for Open-High-Low-Close.
Center of Mass Concept and Calculation
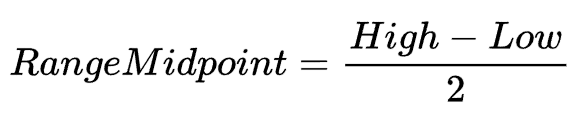
The Center of Mass is a measurement that compares the range of the trading that occurred during the timeframe with the range of open and close values. To find the center of mass you first need to calculate the total range of the candlestick and divide by 2 (Equation 1).
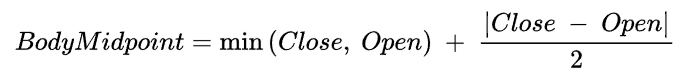
Then, obtain the size of the body and it’s midpoint value. The absolute value of the difference between Open and Close prices will give you the size of the candlestick body. Divide the body size by 2 to obtain the body size midpoint. Finally, add the minimum of Close and Open to obtain the exact dollar value (Equation 2).
The Center of Mass is calculated as the ratio between the Body Midpoint and the Range Midpoint. The Body Midpoint must first be shifted down by the Low. Then, you can take the ratio and subtract 1 (Equation 3).
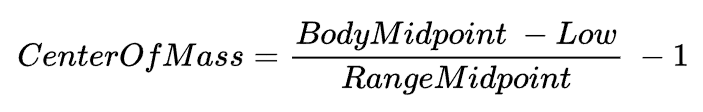
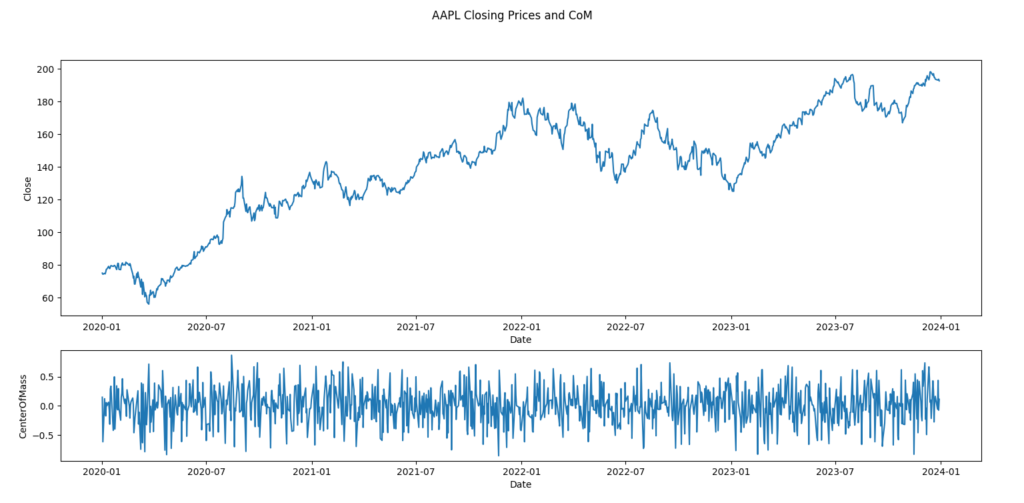
Below is a plot of Center of Mass values calculated from AAPL candlestick data from 2020 to 2023 (Figure 2).
Calculating the Center of Mass in Python
Below is an excerpt of Python code for calculating the Center of Mass value. It utilizes basic Pandas functions and assumes a DataFrame exists with OHLC values (called ohlc_dataframe).
The absolute value in Equation 2 is avoided and substituted for a calculation of the candlestick direction. The function get_direction returns a pandas Series object representing whether the candle is positive (+1), negative (-1) or a Doji (0).
# Assume a DataFrame called ohlc_dataframe with Open, High, Low, Close columns
ohlc_dataframe['HLRange'] = ohlc_dataframe['High'] - ohlc_dataframe['Low']

# Determine Candlestick Direction (positive or negative)
def get_directions(opens, closes):
    opens = opens.to_numpy()
    closes = closes.to_numpy()
    conditions = [opens < closes, opens > closes]
    choices = [1, -1]
    return pd.Series(np.select(conditions, choices, 0))
ohlc_dataframe['Direction'] = get_directions(ohlc_dataframe['Open'], ohlc_dataframe['Close'])

# Obtain Body Size
ohlc_dataframe['BodySize'] = ohlc_dataframe['Direction'] * (ohlc_dataframe['Close'] - ohlc_dataframe['Open'])

# Obtain the Midpoint of the Candlestick Body
ohlc_dataframe['BodyMidpoint'] = (ohlc_dataframe['BodySize'] / 2) + ohlc_dataframe[['Close', 'Open']].min(axis=1)

# Obtain the High-Low Midpoint value
ohlc_dataframe['HLMidpoint'] = ohlc_dataframe['HLRange'] / 2

# Calculate the Center of Mass based on the body midpoint and high-low midpoint
ohlc_dataframe['CenterOfMass'] = (ohlc_dataframe['BodyMidpoint'] - ohlc_dataframe['Low']) / (ohlc_dataframe['HLMidpoint']) - 1
Center of Mass Range of Values
To obtain the possible range of values we need to play with the Body Midpoint value. If the Body Midpoint equals the Low of the timeframe, then the numerator in the ratio equals 0. Subtracting my 1 will yield a minimum value of -1.
For the maximum value, set the Body Midpoint to the High of the timeframe. This means that the Range calculation (High – Low) cancels with the numerator and the ratio equals 2. Subtracting 1 will give you a maximum value of +1.
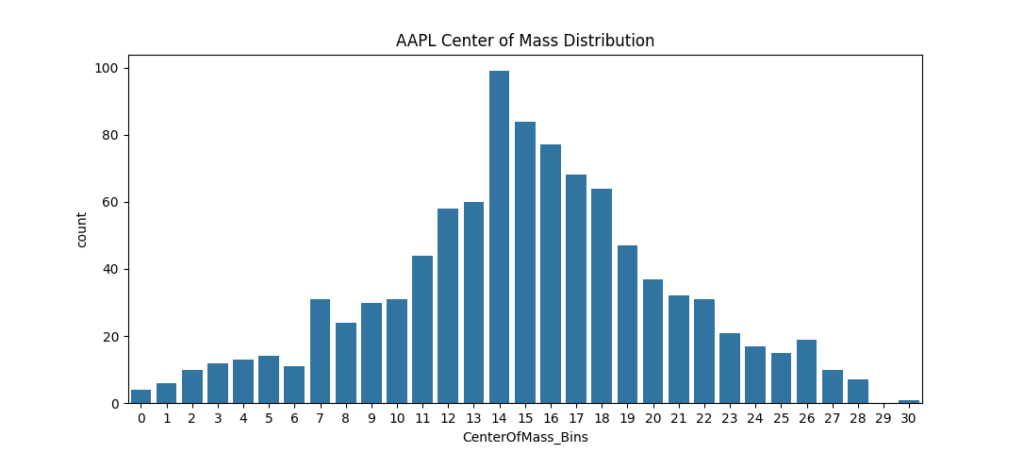
So the range of the Center of Mass is between -1 and +1. The typical values will vary based on the underlying security. It generally follows a skewed Gaussian distribution.
The plot below (Figure 3) shows the distribution of Center of Mass values for Apple Inc’s stock from January 1st, 2020 to December 31st, 2023 with daily candlesticks.
Smoothing the Center of Mass Value
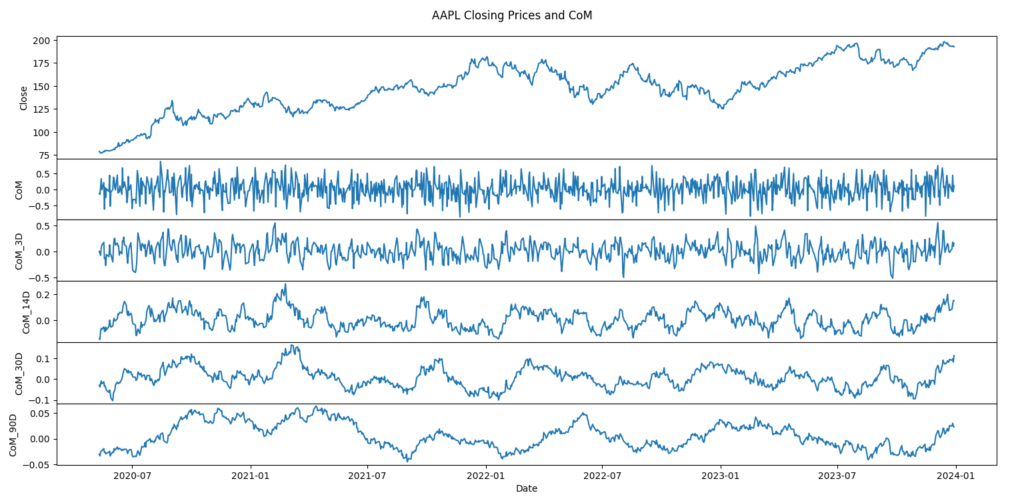
A simple moving average can be applied to the Center of Mass value to extract time-series relationships. Below is a comparison of Simple Moving Averages applied to the Center of Mass value. From top to bottom:
- No smoothing (1-Day)
- 3-Day SMA
- 14-Day SMA
- 30-Day SMA
- 90-Day SMA
Using the Center of Mass to Detect Hammer Candles
As it is, the Center of Mass (CoM) value tells us how “top-heavy” or “bottom-heavy” a particular candlestick is. Higher values of CoM indicate that the candles looks like a “hammer“. Lower values indicate that the candle looks more like an “inverted hammer“.
Some strategies use a hammer candlestick to detect trend reversals. In some implementations of this strategy the direction of the candlestick may not make a difference. For that reason, the CoM might be more useful as an absolute value.
The Python code below shows how to take the absolute value of the Center of Mass value series. Figure 5 shows the result of applying this calculation to AAPL stock.
ohlc_dataframe['Hammer_Detector'] = ohlc_dataframe['CenterOfMass'].abs()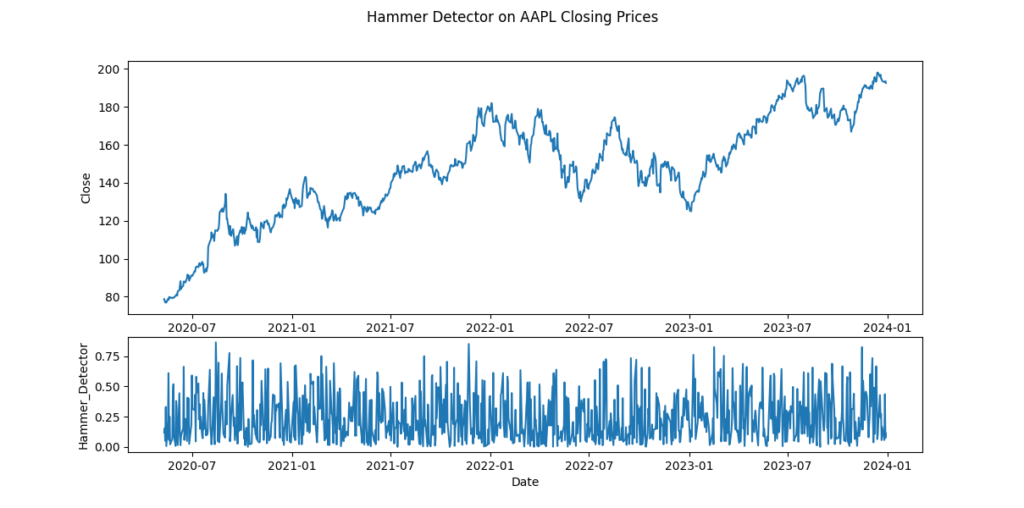
Conclusions and Observations
- The range of CoM SMA values shrinks ten-fold from +/- 0.5 to +/- 0.05. This is due to the nature of averaging, as most of the data is centered around zero.
- The SMA applied to the CoM values is very noisy at low SMA intervals. It is best used to detect specific CoM values generated by individual candlesticks.
- The SMA at 14-day and 30-day intervals provide relatively defined peaks and valleys, allowing for interesting opportunities as an indicator.
- The Center of Mass calculation can be converted into an indicator for detecting Hammer candlesticks.
Hammer Detector Thinkscript Code
Below is the Thinkscript code for the Hammer Detector above. For the Center of Mass indicator, remove the hammer_detector definition and replace it with the “center_of_mass” variable.
# Hammer Detector
# Calculates and plots an indicator for Hammer candle detection based on Center of Mass calculation of candlestick bars.

# Calculate the values for each day
def C = close;
def H = high;
def L = low;
def O = open;

# Calculate Range Midpoint
def range_midpoint = (H - L) / 2;
# Calculate Body Midpoint
def body_midpoint = Min(C, O) + (AbsValue(C - O)) / 2;
# Calculate Center of Mass Value
def center_of_mass = ((body_midpoint - L) / range_midpoint) - 1;
# Calculate Hammer Detector Value
def hammer_detector = AbsValue(center_of_mass);

# Plot the custom indicator line
plot IndicatorLine = hammer_detector;
Author
quantasticresearch.blog@gmail.com

Using a Random Forest Classifier to Classify Candlesticks
[Last Updated: 4/20/2025] Going through my current Data Science & Analytics studies, I was interested in applying a basic supervised learning model...
Read out all